Table of Contents
Last spring, I finally bought a TreasureHunter3D device — the GoldenEye Plus — after months of research and saving. I’d read the specs, watched the few videos I could find, and convinced myself the hardware was worth it. What I didn’t fully realize until the box showed up? The real magic doesn’t happen in the field. It happens after you get home, sitting at your desk, staring at a screen.
I’m talking about PolarWave DATA — the cloud-based analysis platform that turns raw scan data from TreasureHunter3D devices into something you can actually interpret. And as someone who’s spent way too many hours trying to make sense of noisy signal data from cheaper detectors, I can tell you: this software is the difference between owning a deep scanner and actually using one effectively.
How PolarWave DATA Processes GPR Data
Let me back up a second. If you’re used to traditional metal detectors, your workflow probably looks like this: swing coil → hear beep → dig hole → find (or don’t find) something. That’s fine for coin shooting and relic hunting in parks. But when you’re dealing with 3D ground scanners that claim detection depths of up to 35 meters with the GoldenEye Plus — well, you’re not going to dig a 100-foot hole based on a beep.
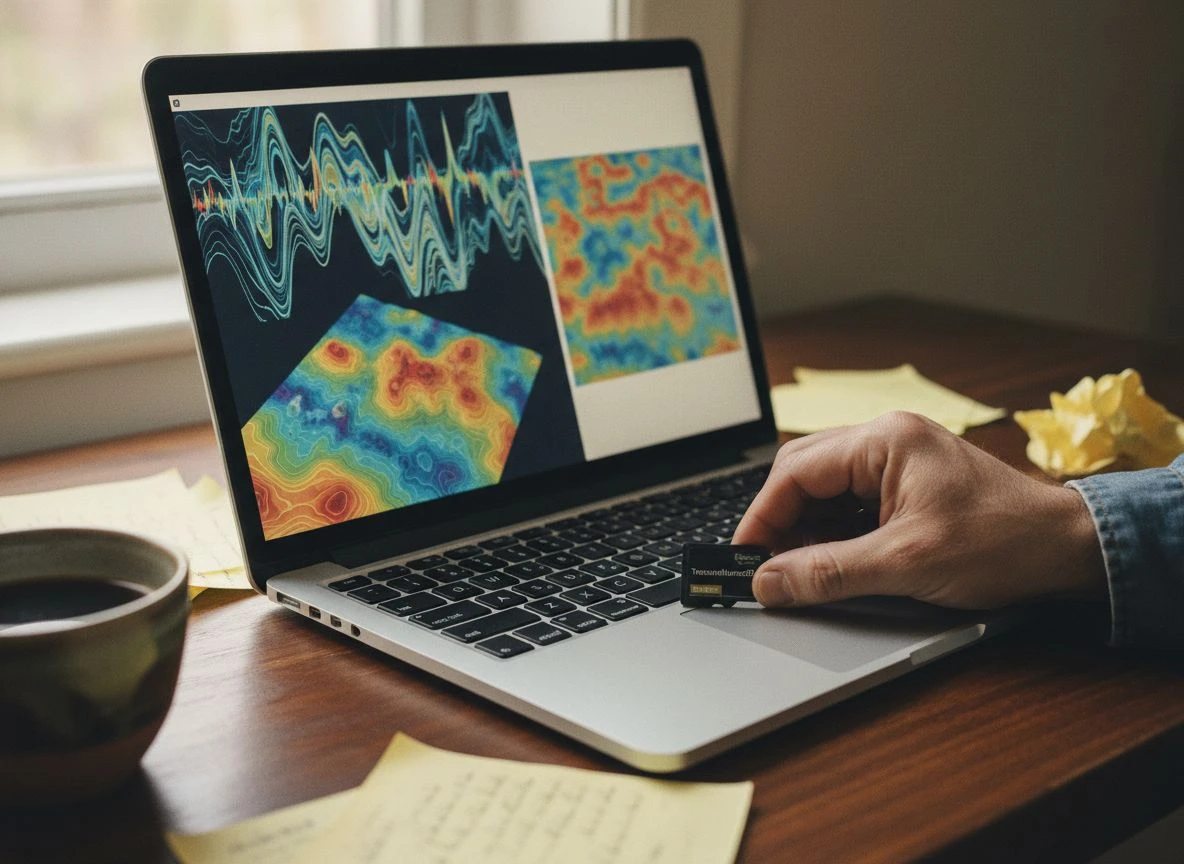
That’s where PolarWave DATA comes in. It’s a cloud-based platform — runs entirely in your browser, no installation needed — that processes and visualizes geophysical survey data from magnetometer and Ground-Penetrating Radar (GPR) scans. You upload your raw files from the field, and within seconds (typically under 15 for magnetometer data, 10–60 for GPR), the platform creates interactive 3D visualizations you can rotate, zoom, and annotate.
The platform supports over 12 instruments, including the full TreasureHunter3D lineup — DroneRover, GoldenEye Plus, GoldenEye, TreasureHunter, and TreasureLight — plus FG Sensors devices and standard binary GPR files. Device detection happens automatically when you upload, so you don’t need to mess with configuration files.
PolarWave DATA’s Four Display Views
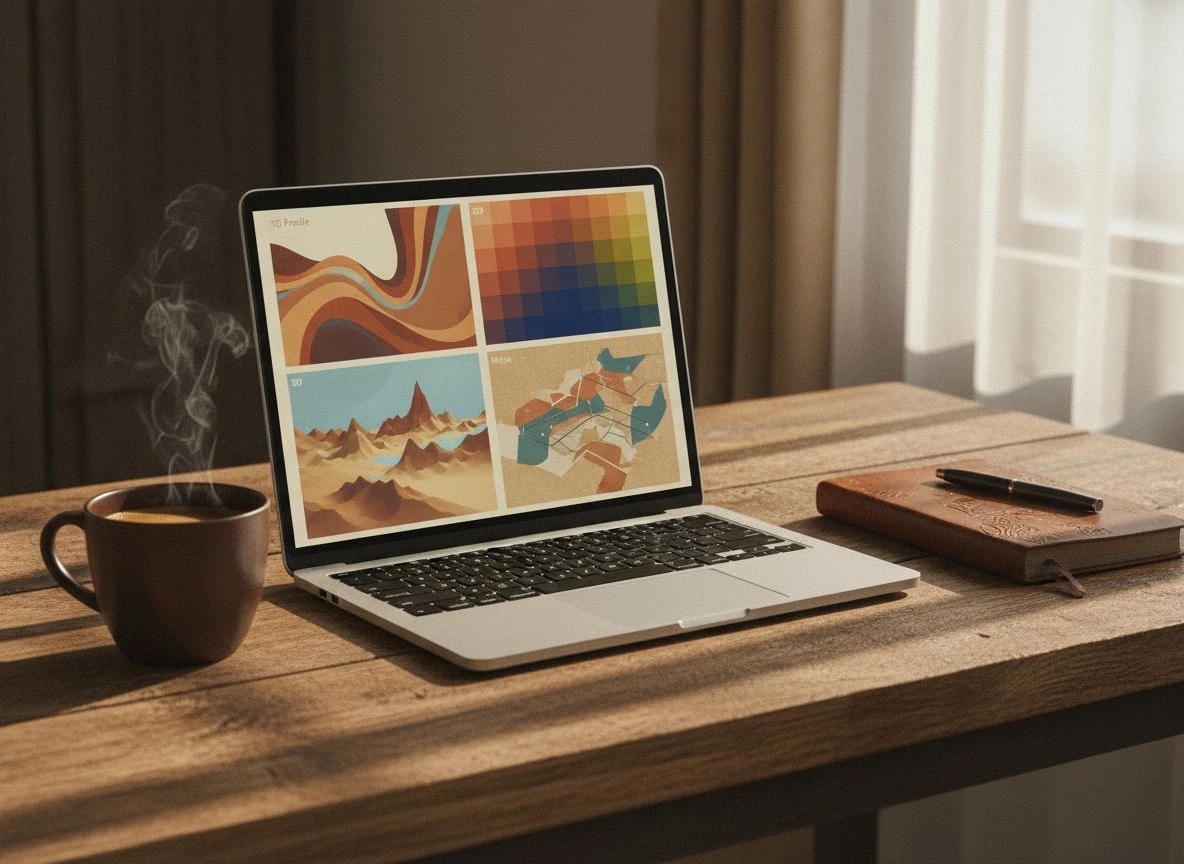
The core of PolarWave DATA is its Magnetometer Viewer, and this is where the software really shines. You get four distinct ways to look at your scan data, and I’ve found myself using all of them depending on what I’m trying to figure out.
The 1D Profile view shows signal intensity as a line graph along your scan path. Units vary by device — TreasureHunter3D devices output a -1 to 1 signal strength, while PolarWave’s own DroneRover measures in nanoTeslas. This view is useful for quick confirmation that you actually picked up something unusual. A sharp spike in the line graph tells you “hey, something’s here” before you bother with the more detailed views.
The 2D Heatmap is where I spend most of my initial analysis time. It renders your data as a color-coded grid — think thermal imaging, but for underground anomalies. You can adjust the sensitivity to highlight weaker anomalies that might be buried deeper or masked by mineralization. This is how I found a promising target last month that turned out to be an old iron cache at about 8 feet down. I’d have missed it entirely at default settings.
The 3D Surface plot is the default view and the one that makes you look like a wizard when showing finds to friends. It renders your scan data as an interactive three-dimensional surface, making anomaly depth and shape immediately visible. You can rotate it, zoom in, and genuinely feel what’s underground before you break ground.
The Maps view overlays your scan on live satellite or street imagery using the GPS coordinates embedded in your files. There’s also a gridding option that interpolates your data into a color-filled map overlay. For a research nerd like me — and I’ll fully own that label — being able to see exactly where my anomalies line up on a satellite image is invaluable. It helps correlate scan tracks with site plans without needing a separate GIS license.
Is PolarWave DATA Essential for GPR Users?
PolarWave DATA also handles Ground-Penetrating Radar files, which is relevant if you’re working with compatible GPR equipment. The GPR processing module offers three view modes: 1D Depth profile, 2D Radargram, and 3D Volume slice.
The Radargram view is the classic GPR display — along-track distance on the horizontal axis, depth (calculated from two-way travel time) on the vertical axis, with signal amplitude shown as color. Buried objects appear as hyperbolic reflections, which takes some getting used to if you’re new to GPR interpretation. But the software includes filters — decimation for faster display, amplification to boost weak reflectors, and smoothing to reduce clutter — that make it easier to pick out targets.
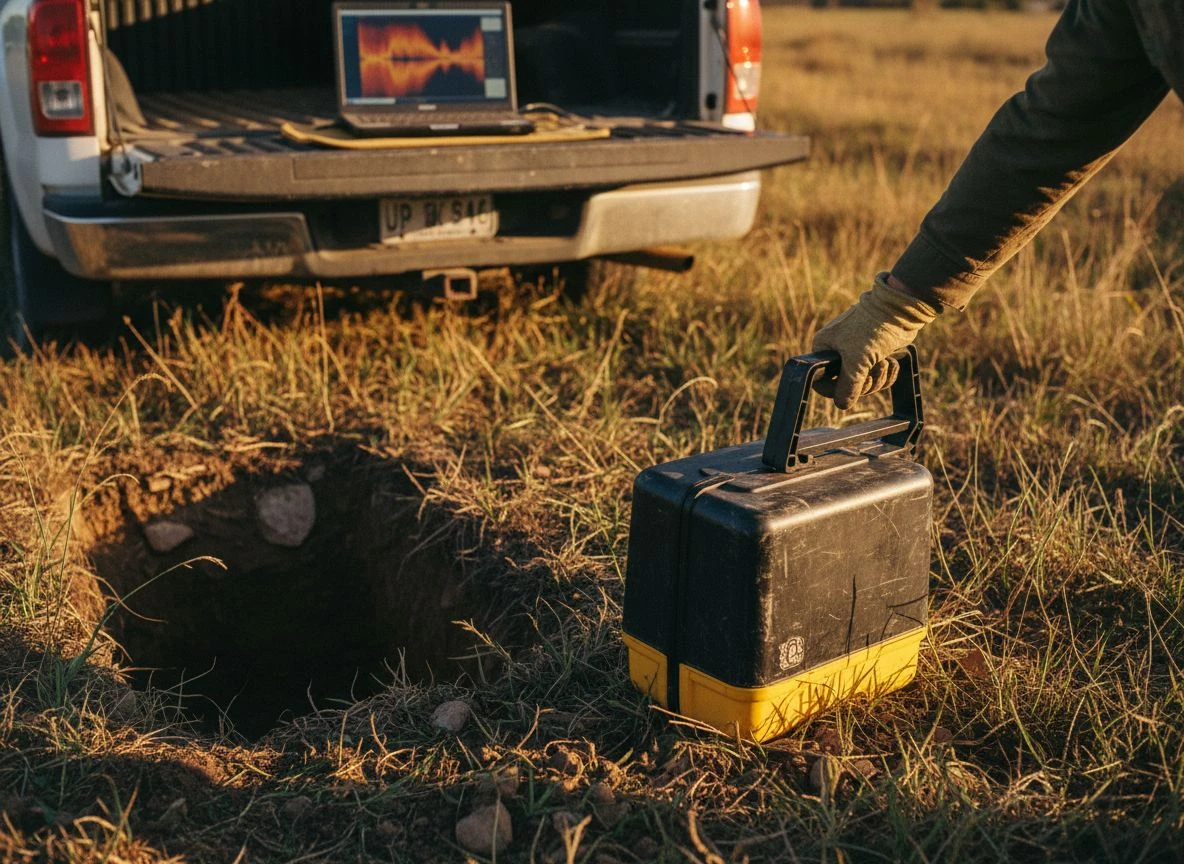
Depth estimation is handled automatically using the formula: Depth (m) = (two-way travel time in ns × propagation velocity) ÷ 2. The platform provides typical velocity values for common materials — dry sand at about 0.15 m/ns, moist soil at 0.08 m/ns — so you’re not guessing.
How Much Does PolarWave DATA Cost?
Here’s where I’m going to level with you, because that’s what this site is for.
PolarWave DATA operates on a credit system. You get 500 free credits upon signup, and each file upload costs 25 credits. That means you get about 20 free scans to start — enough to really test the platform before committing. After that, you’d need to purchase additional credits, though the pricing structure beyond the free tier isn’t prominently advertised on the site. I’ve been working through my initial credits and haven’t hit the paywall yet, so I can’t speak to long-term costs with authority.
The bigger issue — and this came up repeatedly in my research — is documentation. A Reddit user who owns both the DroneRover and GoldenEye Plus noted that “their devices take a while to get used to and the lack of documentation and video tutorials does not help.” I found this to be true of the software as well. The built-in tooltips and basic docs at polarwave.app are functional, but if you’re the type of person who wants a comprehensive user manual before diving in, you’ll be frustrated. Support typically responds within 2–3 business days, which is fine for non-critical questions, but not ideal when you’re in the middle of a field session trying to figure out why your scan looks like static.
Who Should Buy PolarWave DATA?
I think it’s important to be honest about the target audience here. PolarWave DATA is not for someone who just bought a $300 detector and wants to find coins at the local park. This is analysis software designed for people who have invested in 3D ground scanning equipment — whether that’s the TreasureHunter3D line, FG Sensors gear, or compatible GPR systems.
The same Reddit user who flagged the documentation issue also praised the fast workflow, noting that the “integrated 3D processing software directly within the applications” makes the process surprisingly efficient once you’re past the learning curve. I’d echo that. The first few scans I uploaded felt like staring at abstract art. After a weekend of messing with the view modes and sensitivity settings, I was identifying anomalies with confidence.
For archaeologists and survey professionals, the platform’s ability to generate annotated PDF reports with a single click is a genuine time-saver. One archaeological field director quoted on the site noted that the 3D view made anomaly identification “far faster” than their previous workflow. An infrastructure survey engineer appreciated the GPS overlay for correlating scan tracks with site plans — a feature that normally requires dedicated GIS software.
Final Verdict on PolarWave DATA Software
Here’s where I land after several months with PolarWave DATA: it’s the right tool for the right user. If you own a TreasureHunter3D device, it’s essentially mandatory — the data from those scanners doesn’t do you much good without proper visualization. And for a cloud-based platform that runs in your browser with no installation, the processing speed and visualization quality are genuinely impressive.
The documentation gaps are real and frustrating — I’d love to see more video walkthroughs and a proper knowledge base. And I wish the pricing beyond the free credits was more transparent. But the core functionality — four view modes, real-time signal filtering, annotation tools, PDF report generation, and multi-device support — delivers on its promise.
Would I recommend buying a TreasureHunter3D detector just to use this software? Absolutely not. But if you’ve already made that investment — or if you’re a professional surveyor or archaeologist with compatible equipment — PolarWave DATA transforms raw field data into something you can actually act on. And in this hobby, actionable intel is worth every credit.

My name is Paul and I am the founder of Detector For Metal, a dedicated resource for metal detecting enthusiasts seeking to uncover historical treasures and connect with the past using the latest technology. As a stay-at-home dad and family man, I’ve found metal detecting to be the perfect hobby that combines family adventure with historical learnings for the whole family.
As a father, I’m deeply committed to passing on this hobby to the next generation of detectorists, starting with my own children. I share advice on everything from metal detecting with kids to exploring the top 10 metal detecting sites you never thought about. My methodical approach to the hobby goes beyond the thrill of discovery—it’s about creating family traditions while preserving history and sharing the stories of those who came before us.