Table of contents
- Why Naptime Is Prime Research Time
- Build a Research Log That Survives Interruptions
- MapChart or Google My Maps for Busy Parents
- A 15-Minute Daily Mapping Routine
- How Historical Mapping for Metal Detecting Breaks Walls
- Seven Free Historical Mapping Sources
- Let Relatives Help With Your Research
- Common Historical Mapping Questions Answered
- Your One-Page Naptime Research Plan
The blueprint is simple: one ancestor, one question, one map layer, done. You’re not building a full family atlas during naptime. You’re plotting a single migration route or confirming one old jurisdiction before the baby stirs. Professional genealogist Jennifer Dondero suggests breaking research into 15-minute chunks. Focused micro-sessions like these produce real results without much prep.
Here’s the sequence I’ve settled on after enough interrupted sessions to lose count. Before you open any mapping tool, pull up your research log and read the “next steps” field. That’s your starting point. Then open either MapChart.net or Google My Maps — whichever you logged for this task. Then do exactly one thing: add a marker, draw a route, or confirm a county boundary. That’s it.
This works because you’ve already done the thinking. The log tells you what to map. You picked the tool last session. The only thing left is the simple act of plotting the point.
And listen — some sessions will be a bust. The baby wakes early. The county boundary data won’t line up with the modern map. Or you spend 20 minutes trying to remember which email you used for your Google account. That’s normal. Log the failure, write “next step: reset password” or whatever it is, and close the laptop. The blueprint survives because the log survives.
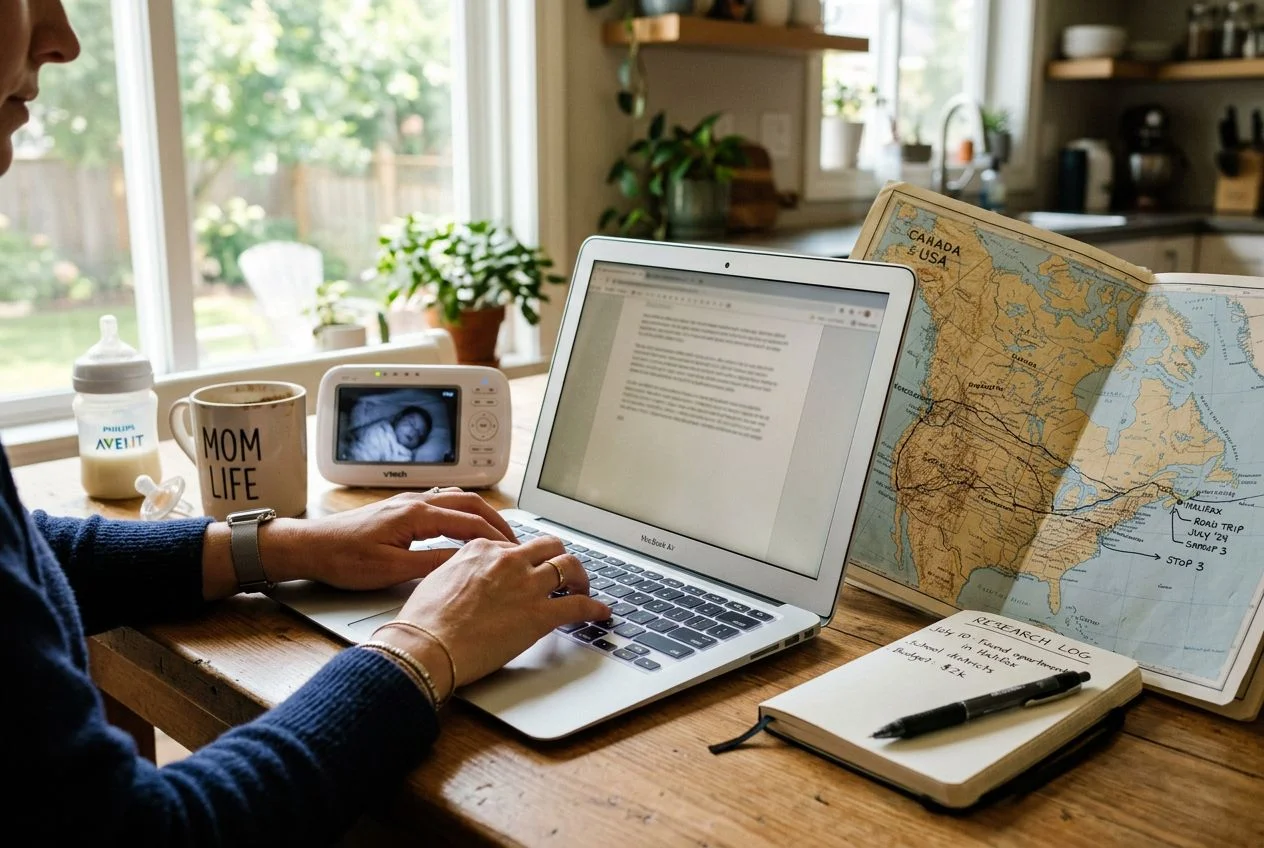
One trick that’s saved me more than once: keep historical map tabs pre-loaded before naptime starts. When my son was in a phase of 22-minute naps, those pre-opened tabs were the difference between zero progress and one plotted county line. It’s not glamorous, but it compounds.
Why Naptime Is Prime Research Time
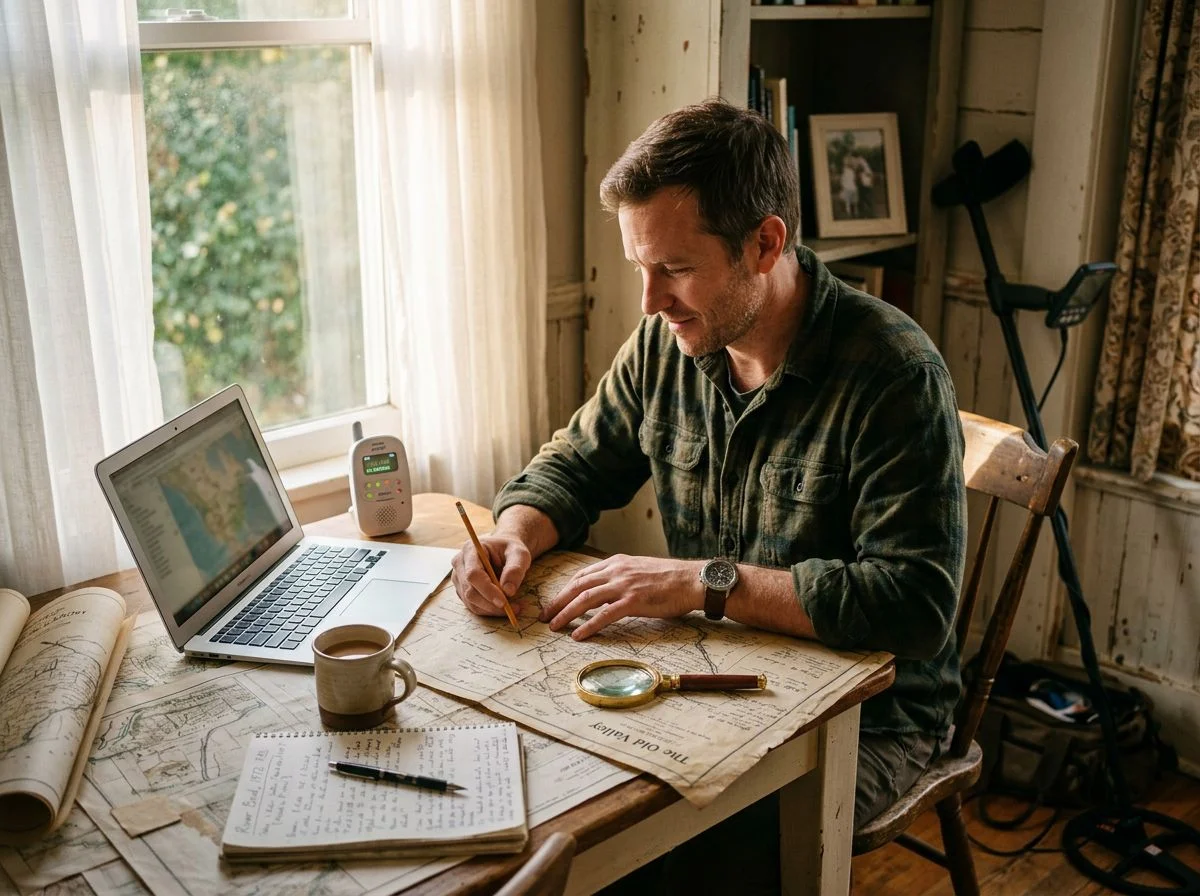
Twenty-five focused minutes beats a free Saturday, every time. The constraint isn’t the enemy — it’s the whole game. When the clock is ticking toward a baby waking up, you don’t scroll. You don’t chase shiny tangents. You execute.
Here’s what I’ve learned after enough naptime sessions to fill a spreadsheet: open-ended availability is where research goes to die. Give me a free Saturday with no plan, and I’ll spend three hours “getting organized.” That’s code for reorganizing browser bookmarks and reading forum threads about other people’s breakthroughs. Give me 25 minutes with a logged next step, and I’ll plot a county boundary, confirm a migration route, or map that 1880 census address before the monitor warms up.
The Pomodoro Technique is built on exactly this principle. Set a timer for 25 minutes of focused work. Take a 5-minute break. Repeat. The research isn’t new — it’s just that nobody applies it to family history. But the structure works because it creates artificial scarcity. When you know the session ends in 25 minutes, you stop optimizing and start doing.
And here’s the math that actually matters: fifteen minutes a day adds up to more than 90 hours of research per year. That’s not a typo. Fifteen minutes. Most naptimes give you 25, sometimes 45. Even if you only manage three naptime sessions a week — and let’s be honest, some days the dishes win — you’re still stacking hours that a “someday” free weekend will never deliver.
The free Saturday is a myth anyway. Something always fills it. The naptime window is real, it’s recurring, and it’s short enough to force the kind of focus that actually produces results. That’s not a limitation. That’s leverage.
Build a Research Log That Survives Interruptions
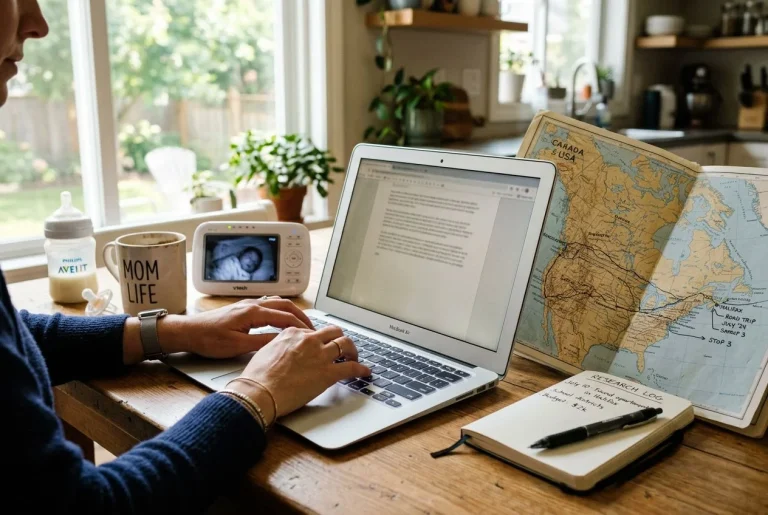
A research log is where your session lives when the baby wakes up. It’s not optional for naptime work. It’s the difference between losing 40 minutes and losing 40 seconds. Here’s what happened to me last month.
I was 25 minutes into plotting my great-grandfather’s migration from Tuscany to New York when my son woke up screaming from a nightmare. Not a whimper — the full-blown, needs-to-be-held-for-an-hour kind of scream. By the time I got back to the laptop, the browser had auto-updated. My tabs were gone. I couldn’t remember which county I’d been mapping or which source I’d been cross-referencing. Forty minutes of work, vaporized. Except it wasn’t — because I’d logged my next step before I even opened Google My Maps.
The Genealogist’s Guide to Time Management recommends logging four fields every session: the research date, sources examined (including URLs), findings, and next steps. That last field is the one that saved me. My entry read: “Next step: confirm Tuscany comune boundary for 1885 using MapChart historical layer.”
Thirty seconds of reading after my son finally settled, and I was back in the exact spot I’d left. No re-orientation. No scrolling through browser history to reconstruct my thought process.
Keep the log in a single searchable document — Google Docs, Notion, whatever you already use. The format matters less than the consistency. Every session ends with a next step, even if that next step is “figure out why the 1880 census page won’t load.” Log the failure, write the next action, close the laptop. The trail survives even when the session doesn’t.
That’s the whole point of the external brain. You’re not relying on memory, which is unreliable at the best of times and useless at 3 a.m. with a toddler on your hip. You’re relying on a system that picks up exactly where you left off, every single time.
MapChart or Google My Maps for Busy Parents
The short answer: MapChart wins when you need a finished visual before the baby stirs. Google My Maps wins when you need a living document that survives multiple interrupted sessions. If you’ve got 20 minutes and want something you can show your mother-in-law, MapChart. If you’re building a research asset you’ll return to for months, My Maps.
Here’s the thing about MapChart’s color-coded historical borders — they’re stupidly satisfying to use. You pick a year. The borders shift to what Europe actually looked like then. You click a country to fill it. No layers to manage, no pins to place, no interface to learn. I mapped my great-grandfather’s Tuscany-to-New-York route in one naptime session, and it looked like something from a history textbook. The catch? It’s a static image. You can’t add notes or invite your cousin to contribute. You can’t click a region to see which source document backs it up.
Google My Maps is the opposite trade. It’s slower to set up — you’re placing markers, naming layers, drawing routes. But the layer-based collaboration means your research survives as a working document. I’ve got a My Maps project for my wife’s side of the family. Three relatives have added to it over the past year. Nobody’s adding anything to a MapChart screenshot.
The FamilySearch guide recommends both, and honestly, that’s the right call for different jobs. MapChart for quick visual answers — “what did the border look like when they left?” My Maps for ongoing research — “which documents do we have for each stop?” Which can you actually finish before a toddler wakes up? MapChart, every time. Which one will still be useful next month? That’s My Maps.
A 15-Minute Daily Mapping Routine
Fifteen minutes daily doesn’t sound like much, but it compounds into more than 90 hours of research per year. That’s enough to map an entire branch of your family tree with room to spare. The math works because consistency beats intensity every time.
Family History Daily ran the numbers, and the conclusion is almost embarrassing in its simplicity: 15 minutes a day, 365 days a year, adds up to over 90 hours of active research. That’s two full work weeks spent on genealogy. No blocking out a Saturday. No negotiating a “research day” with your spouse. For a naptime researcher, this is the whole game. You’re not trying to win a marathon session. You’re trying to build a streak.
The trick is that 15 minutes is short enough to actually happen. Nicole Dyer’s tips for busy parents hit this exact note. She recommends tracking your daily activities to find the hidden pockets of time you’re already wasting. Then slot genealogy into those gaps. For me, that pocket used to be the 20 minutes I spent scrolling my phone after the kids went down. Now it’s the 15 minutes I spend opening my research log and executing one next step. Same time slot. Completely different output.
The momentum piece matters more than the math. When you research daily, even briefly, the context stays loaded in your head. You don’t spend the first 10 minutes of every session re-orienting. You just pick up the thread and pull. That’s why the research log from the last section matters so much. It’s what makes a 15-minute session productive instead of preparatory. You log the next step, walk away, and tomorrow’s 15 minutes starts with action, not orientation.
Don’t try to do more than 15 minutes at first. The goal is the streak, not the session length. Once the habit’s locked in, the occasional 45-minute naptime bonus feels like found money.
How Historical Mapping for Metal Detecting Breaks Walls
Historical mapping for metal detecting works by preserving what databases flatten into searchable fields — the shifting borders, renamed jurisdictions, and vanished landmarks that explain why your ancestor’s records seem to disappear. A database tells you what was recorded. A map tells you where it was recorded. That distinction breaks brick walls.
Here’s the problem with relying on modern record databases alone: they’re built on current assumptions about geography. You search for Washington County, Alabama records from 1815, and the database confidently returns nothing. Why? Because in 1815, the place you’re looking for wasn’t called Washington County, Alabama. It was part of the Mississippi Territory. Professor Robert Davis explains that when the Alabama Territory was created in 1817, it split Washington County down the middle. That created two distinct Washington counties that shifted over time. Your ancestor didn’t move. The borders did. But a database search won’t tell you that.
Maps do. When you pull up a historical map from the right year, you can see exactly which jurisdiction held your ancestor’s land at the moment the record was created. That’s the difference between searching the right archive and endlessly refreshing a results page that says “no matches found.”
Jessica Neaves found her breakthrough this way. She’d hit a wall trying to locate her 3x great-grandmother’s house in Ludlow, Massachusetts. The address simply didn’t exist in any modern database. Then she pulled a land ownership map from the Library of Congress. There it was: the house, labeled with her ancestor’s name, sitting on a street that had since been renamed and partially redeveloped. The map didn’t just confirm the house existed. It showed her the neighborhood layout, the nearby landmarks, the context that made the record searchable in the first place.
That’s the real power of historical maps for naptime researchers. They’re not just pretty visuals for your family tree. They’re the key that unlocks which records to search, which jurisdictions to check, and which archives actually hold what you’re looking for. When a database search fails, the map tells you why. And once you know why, you know exactly where to look next.
Seven Free Historical Mapping Sources
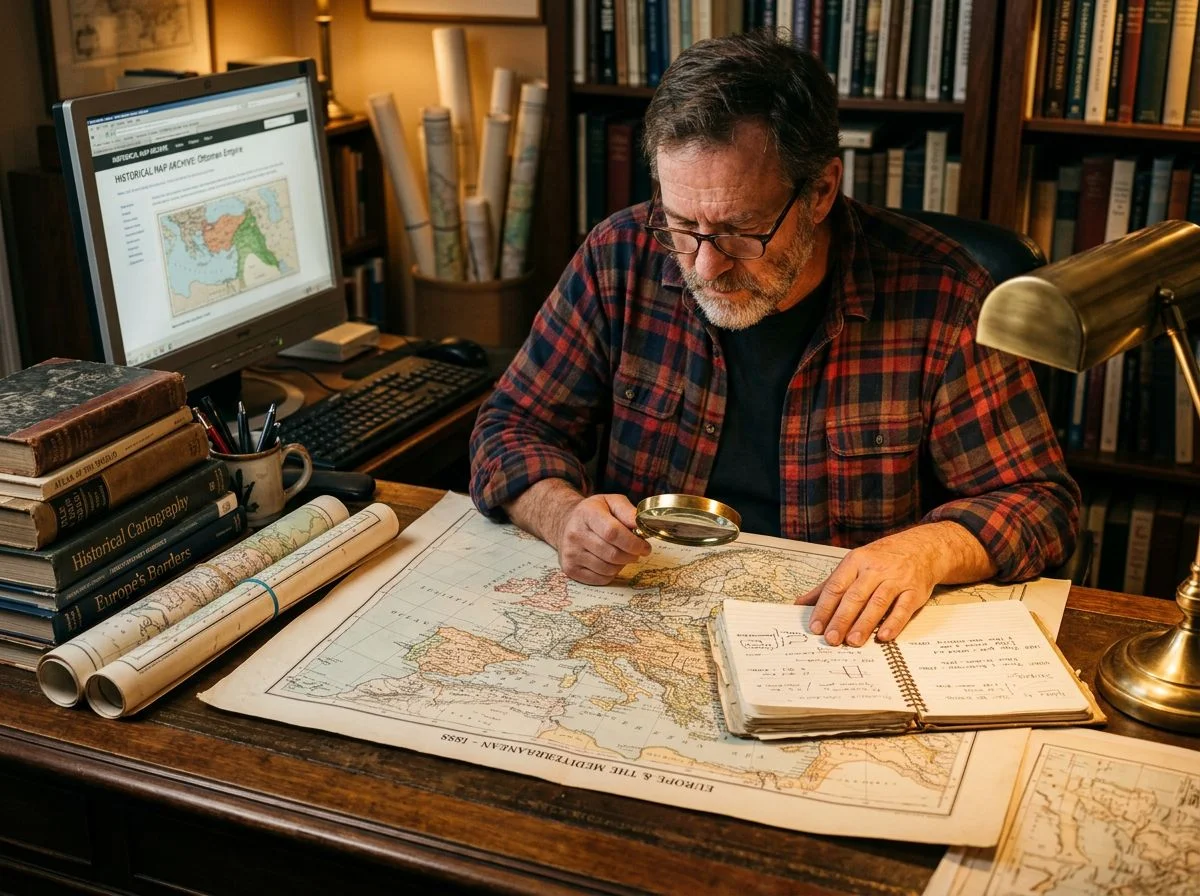
You don’t need a subscription to access world-class historical maps. Family History Fanatics compiled seven free websites that cover everything from modern reference layers to century-old fire insurance surveys. Every single one is available the moment your kid’s eyes close. How many of these seven free sources have you actually opened this month?
Start with the two heavy hitters. The David Rumsey Historical Map Collection hosts tens of thousands of high-resolution maps spanning centuries. They’re scanned at resolutions detailed enough to read individual property labels. I’ve pulled up 1880s plat maps from there and spotted my ancestor’s name printed on his farm plot. That’s the kind of detail that turns a map from reference material into evidence.
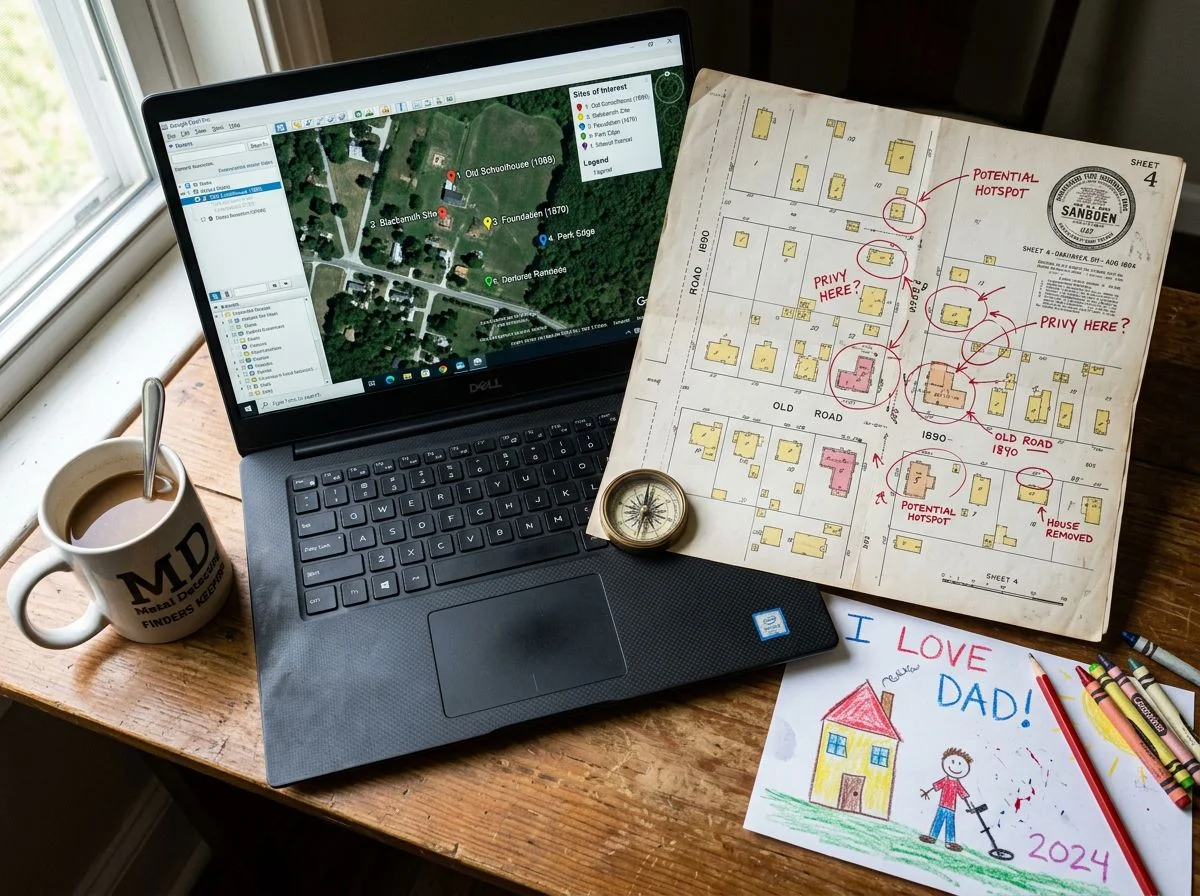
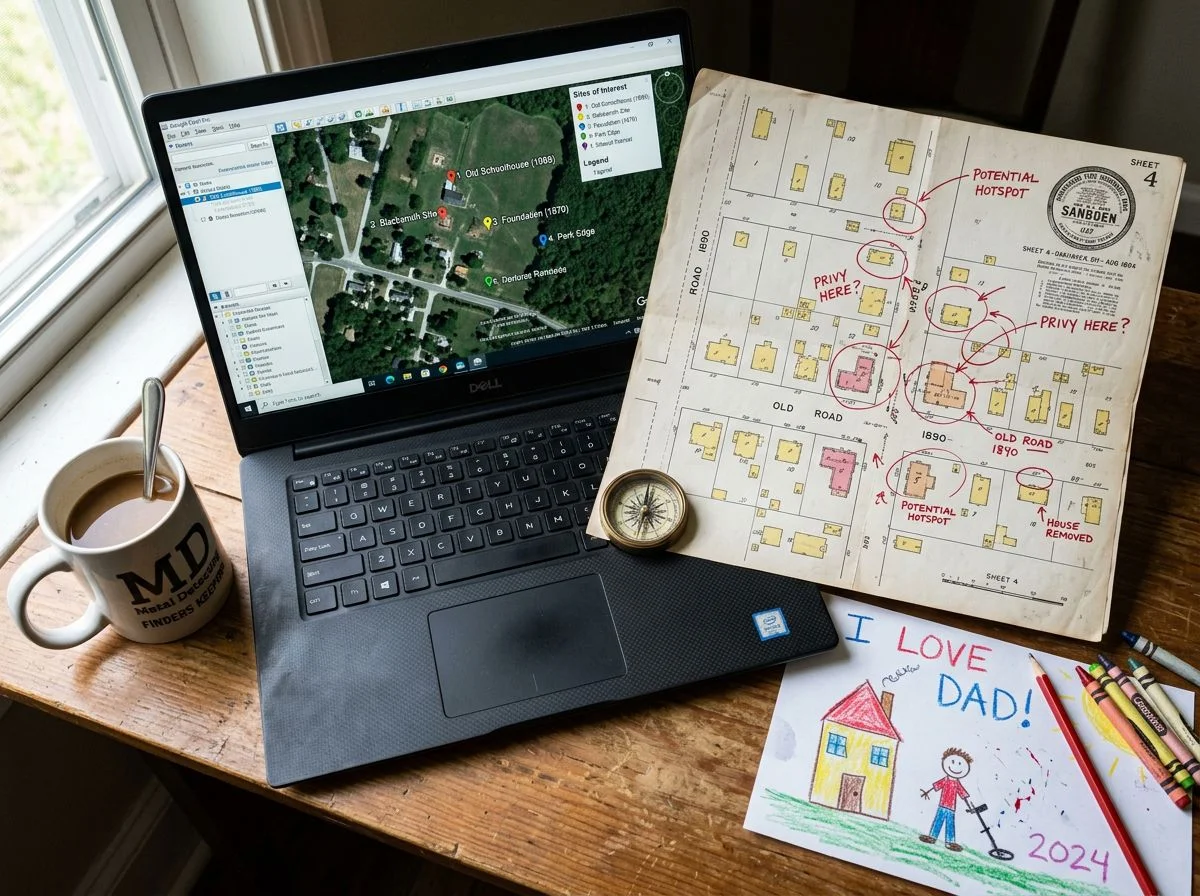
Then there are the Sanborn Fire Insurance Maps. These are frankly obsessive in their documentation. Insurance underwriters produced them starting in the late 19th century. They show building footprints, construction materials, and even outbuildings for thousands of American towns. If your ancestor lived in a city, Sanborn maps can show you the exact house — sometimes down to whether they had a porch. The Library of Congress hosts a massive digitized collection.
The Internet Archive is the sleeper pick here. It’s full of historical atlases, county histories, and published map books that never made it into curated collections. Search by county name plus “atlas” and you’ll be surprised what surfaces.
Google Maps rounds out the list as your modern reference layer. It’s useful for comparing historical boundaries against current streets. The Library of Congress map collections add military maps, land ownership records, and panoramic views.
None of these cost a dime. The only thing they’ll cost you is the discipline to stop browsing and start mapping.
Let Relatives Help With Your Research
You don’t have to plot every ancestral location yourself. Google My Maps’ collaborative editing feature lets you share your map with relatives. They can add their own pins, notes, and family knowledge. Your naptime project becomes a family-wide operation.
Here’s how this actually played out for me. I’d been mapping my maternal line’s migration through the Midwest. I’d hit a wall on where my great-great-aunt settled after leaving Ohio. So I sent the map link to my cousin Diane with a note: “Hey, if you remember anything about Aunt Ruth’s places, feel free to add them.”
Then I took a nap. A real one — the baby was down, and I was running on four hours of sleep.
When I woke up 40 minutes later, Diane had plotted three locations I didn’t even know existed: a farm outside Terre Haute, a boarding house in Indianapolis where Aunt Ruth lived during the war, and a cemetery plot in a tiny town I’d never heard of. She’d added notes to each pin with dates and little family stories. No phone calls, no back-and-forth emails. She just added what she knew.
That’s the beauty of collaborative mapping. Your relatives hold pieces of the puzzle you’ll never find in a database. The “oh, she lived with the Hendersons for a while” details that never made it into any record. Giving them edit access means they can contribute on their own schedule, and you don’t have to transcribe anything.
Set the sharing permissions to “anyone with the link can edit” and send it to a few key relatives. Then watch what happens. You might wake up from your next nap with half your migration route already plotted.
Common Historical Mapping Questions Answered
You’re not failing. You’re researching in 25-minute increments. That’s the honest answer to most of the questions below. The math works in your favor if you stop measuring progress against genealogists with empty houses and open Saturdays.
“Is 15 minutes a day actually worth it?” Professional genealogist Jennifer Dondero built an entire campaign around this question. Her #lunchtimegenealogist series was designed for people squeezing research into lunch breaks and naptimes. She’s been doing this for nearly 30 years while raising two kids. The math backs her up: 15 minutes daily adds up to more than 90 hours of active research per year. That’s two full work weeks. You’d be shocked what you can map in 90 hours.
“Should I wait until the kids are older?” No. The records you need are being digitized right now, and the relatives who hold the unwritten stories aren’t getting younger. Plot one location per session. That’s it. One pin, one note, done.
“What if I forget where I left off?” That’s what the research log is for, and I covered it earlier. Log your next step before you close the laptop. Future you will be grateful.
“Am I doing this wrong if I only map one ancestor per week?” You’re doing it wrong if you’re mapping zero. One ancestor per week is 52 ancestors a year. Most people don’t know 52 ancestors’ locations.
Your One-Page Naptime Research Plan
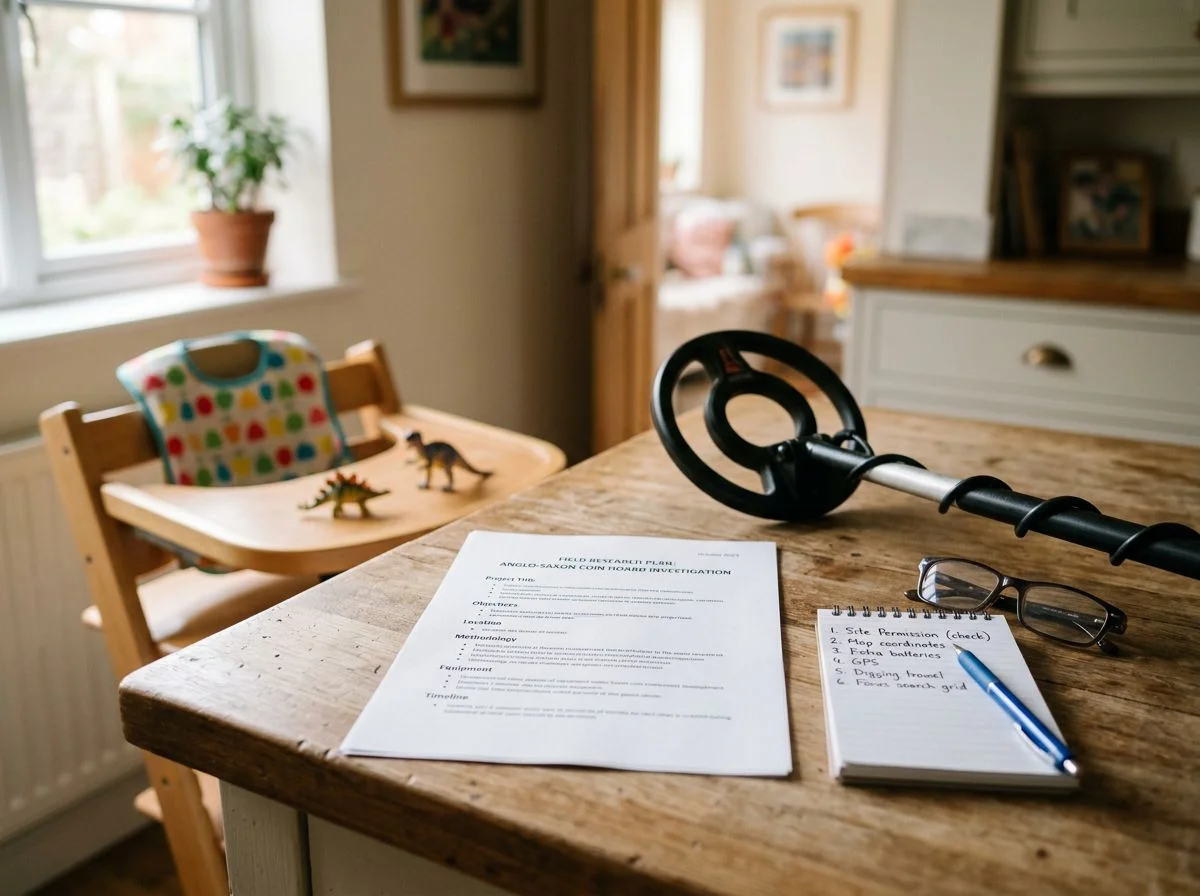
Set a 25-minute timer, log your next step before you close the laptop, and commit to 15 minutes daily. That’s the whole system. The parent with a plan beats the enthusiast with a weekend. Every single time.
Here’s the synthesis, stripped bare. You work in Pomodoro cycles — 25 focused minutes, then you’re done. No negotiating with the clock. When the baby stirs, you stop. And that’s fine, because your research log already has the answer to “where was I?” waiting for you.
The log fields are non-negotiable: research date, sources examined with URLs, findings, and next steps. That last field is the one that saves you. Write it before you close the tab, every session, no exceptions.
Then there’s the 15-minute daily cadence. It compounds to more than 90 hours of research per year — two full work weeks of mapping, plotting, and connecting dots. Most hobbyists with open Saturdays don’t log 90 productive hours in a year. You will, and you’ll do it in stolen minutes while the house is quiet.
One pin per session. One log entry. One next step. Repeat until your migration routes start looking like actual family history instead of random dots on a screen. That’s the blueprint. Now go take a nap — you’ve earned it.

My name is Paul and I am the founder of Detector For Metal, a dedicated resource for metal detecting enthusiasts seeking to uncover historical treasures and connect with the past using the latest technology. As a stay-at-home dad and family man, I’ve found metal detecting to be the perfect hobby that combines family adventure with historical learnings for the whole family.
As a father, I’m deeply committed to passing on this hobby to the next generation of detectorists, starting with my own children. I share advice on everything from metal detecting with kids to exploring the top 10 metal detecting sites you never thought about. My methodical approach to the hobby goes beyond the thrill of discovery—it’s about creating family traditions while preserving history and sharing the stories of those who came before us.